OECD | Tax revenues have reached a plateau
Table of Contents
Source: OECD
Tax revenues in advanced economies reached a plateau during 2018, with almost no change seen since 2017, according to new OECD research. This ends the trend of annual increases in the tax-to-GDP ratio seen since the financial crisis.
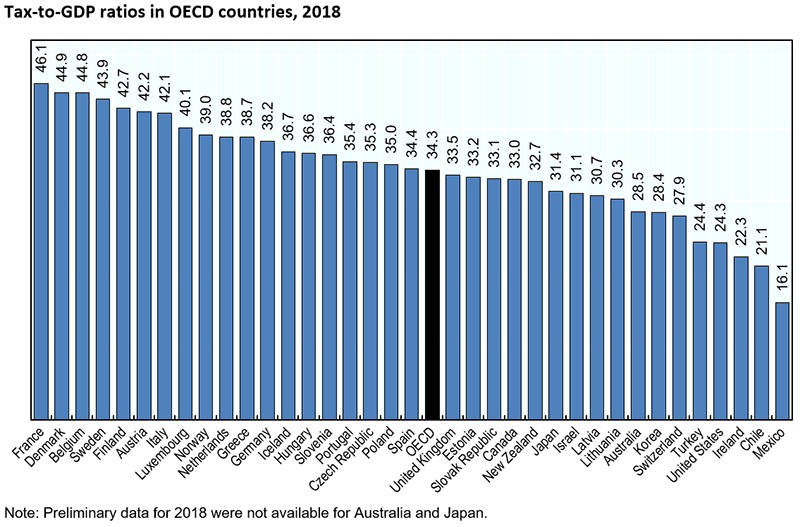
The 2019 edition of the OECD’s annual Revenue Statistics publication shows that the OECD average tax-to-GDP ratio was 34.3{780f53c297e2c008074d23b865a0ce0b35a4f08852d8e1e49466a5a902c4e44e} in 2018, virtually unchanged since the 34.2{780f53c297e2c008074d23b865a0ce0b35a4f08852d8e1e49466a5a902c4e44e} in 2017.
Major reforms to personal and corporate taxes in the United States prompted a significant drop in tax revenues, which fell from 26.8{780f53c297e2c008074d23b865a0ce0b35a4f08852d8e1e49466a5a902c4e44e} of GDP in 2017 to 24.3{780f53c297e2c008074d23b865a0ce0b35a4f08852d8e1e49466a5a902c4e44e} in 2018. These reforms affected corporate income tax revenues, which fell by 0.7 percentage points, and personal income tax revenues (a fall of 0.5 percentage points).
Decreases were also seen in 14 other countries, led by a 1.6 percentage point drop in Hungary and a 1.4 percentage point drop in Israel. In contrast, nineteen OECD countries report increased tax-to-GDP ratios in 2018, led by Korea (1.5 percentage points) and Luxembourg (1.3 percentage points).
In 2018, four OECD countries had tax-to-GDP ratios above 43{780f53c297e2c008074d23b865a0ce0b35a4f08852d8e1e49466a5a902c4e44e} (France, Denmark, Belgium and Sweden) and four other EU countries also recorded tax-to-GDP ratios above 40{780f53c297e2c008074d23b865a0ce0b35a4f08852d8e1e49466a5a902c4e44e} (Finland, Austria, Italy and Luxembourg). Five OECD countries (Mexico, Chile, Ireland, the United States and Turkey) recorded ratios under 25{780f53c297e2c008074d23b865a0ce0b35a4f08852d8e1e49466a5a902c4e44e}. The majority of OECD countries had a tax-to-GDP ratio between 30{780f53c297e2c008074d23b865a0ce0b35a4f08852d8e1e49466a5a902c4e44e} and 40{780f53c297e2c008074d23b865a0ce0b35a4f08852d8e1e49466a5a902c4e44e} of GDP in 2018.

Corporate income tax revenues continued their increase since 2014, rising to 9.3{780f53c297e2c008074d23b865a0ce0b35a4f08852d8e1e49466a5a902c4e44e} of total tax revenues across the OECD in 2017. This is the first time corporate income tax revenues have exceeded 9{780f53c297e2c008074d23b865a0ce0b35a4f08852d8e1e49466a5a902c4e44e} of total tax revenues since 2008.
In contrast, the share of social security contributions in total tax revenues continued the consistent decline seen in recent years, dropping to 26{780f53c297e2c008074d23b865a0ce0b35a4f08852d8e1e49466a5a902c4e44e} in 2017, compared to 27{780f53c297e2c008074d23b865a0ce0b35a4f08852d8e1e49466a5a902c4e44e} in 2009. Other tax types have not exhibited a clear trend in recent years.
This year’s report contains a Special Feature that reconciles data on environmentally related tax revenues in Revenue Statistics with theOECD Policy INstruments for the Environment (PINE) database. This exercise provides higher-quality data for policymakers and researchers in this important policy area.
The Special Feature shows that environmentally related tax revenues accounted for 6.9{780f53c297e2c008074d23b865a0ce0b35a4f08852d8e1e49466a5a902c4e44e} of total tax revenues on average in OECD countries in 2017, ranging from 2.8{780f53c297e2c008074d23b865a0ce0b35a4f08852d8e1e49466a5a902c4e44e} in the United States to 12.5{780f53c297e2c008074d23b865a0ce0b35a4f08852d8e1e49466a5a902c4e44e} in Slovenia and Turkey. As a share of GDP, environmental taxes account for 2.3{780f53c297e2c008074d23b865a0ce0b35a4f08852d8e1e49466a5a902c4e44e} on average, with country shares ranging from 0.7{780f53c297e2c008074d23b865a0ce0b35a4f08852d8e1e49466a5a902c4e44e} in the United States to 4.5{780f53c297e2c008074d23b865a0ce0b35a4f08852d8e1e49466a5a902c4e44e} in Slovenia. The largest share of ERTRs is derived from energy taxes, both on average and in nearly every OECD country, accounting for nearly three-quarters of ERTRs, according to the report.
Detailed country notes provide further data on national tax-to-GDP ratios and the composition of the tax mix in OECD countries. To access the report and data, go to http://oe.cd/revenue-statistics.
